
Spread: what the average leaves out
Two places with the same average temperature can feel nothing alike; range and standard deviation measure how far values wander from the middle.
SAME AVERAGE, DIFFERENT DAYS
Two cities that look identical on paper
City A has five days at 18, 19, 20, 21 and 22 °C. City B has five days at 10, 15, 20, 25 and 30 °C. Both have a mean of 20 and a median of 20. Judged by the average alone they are the same place. Anyone who has lived in both would disagree. The missing piece is spread: how far the values wander from the middle.
In A, every day is within 2 degrees of 20. In B, one day is 10 degrees colder and another 10 degrees warmer.
Check yourself
City A's days were 18, 19, 20, 21, 22 °C and City B's were 10, 15, 20, 25, 30 °C. What are their means?
- A is 20 and B is 20
- A is 20 and B is 25
- A is 18 and B is 10
- A is 4 and B is 20
Show the answer
A is 20 and B is 20
Right. Each set adds up to 100, and 100 divided by 5 is 20. Same mean, very different weeks, which is exactly why the average alone isn't enough.
Step through it
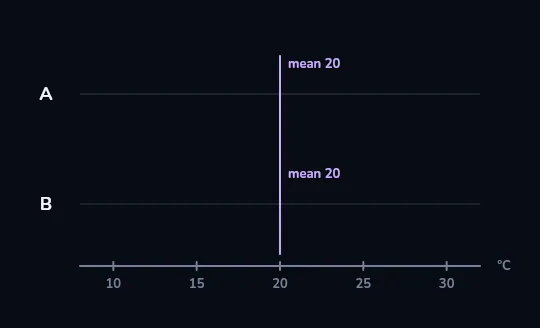
Two cities, both averaging 20 °C Two rows, one for city A and one for city B, on a shared temperature axis. A single lilac line marks 20 degrees, labelled mean 20 on both rows. No days are drawn yet, so for now the two cities look identical.
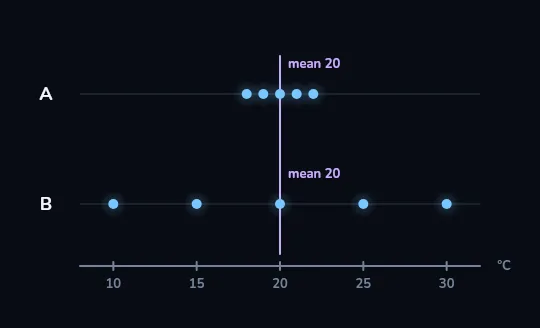
The five days in each city Now the five days appear as blue dots. A's days crowd tightly around 20, from 18 to 22. B's are scattered from 10 all the way to 30, even though their average is the same line.
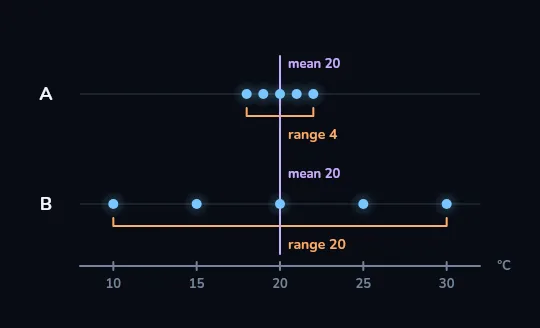
The range: coldest to warmest day An orange bracket under each row runs from the coldest day to the warmest. It spans 4 degrees in A (18 to 22) and 20 degrees in B (10 to 30).
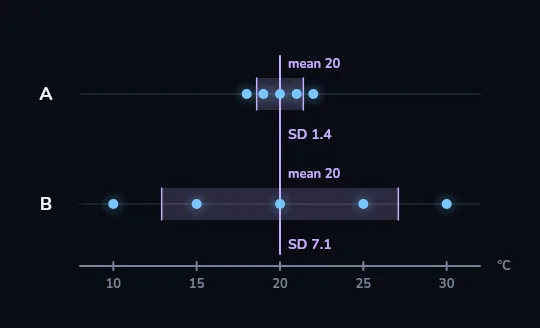
Standard deviation: the typical distance The brackets fade and a lilac band appears around 20 on each row, one standard deviation wide on each side. That is the typical distance of a day from the average: about 1.4 degrees in A, about 7 in B. Some days, like 10 and 30 in B, sit outside their band.
Check yourself
Cities A and B both average 20 °C. For which one would you pack both a coat and shorts?
- City A, range 4, SD about 1.4
- City B, range 20, SD about 7
- Either: with the same average you'd pack the same things
Show the answer
City B, range 20, SD about 7
Right. B's days run from 10 to 30 °C, so you'll meet both cold and hot days. In A you'd never leave the 18 to 22 band.
Range
The largest value minus the smallest. It's the quickest measure of spread, but it depends on only two numbers, the two most extreme ones, so a single odd day can change it completely.
A: 22 − 18 = 4. B: 30 − 10 = 20. Add one freak 35 °C day to A and its range jumps from 4 to 17, though the other five days haven't changed.
Standard deviation (SD)
Roughly, the typical distance of a value from the mean. It uses every value, not just the extremes, and it comes in the same units as the data. You don't need the formula: read "mean 20 °C, SD 7 °C" as "most days are within about 7 degrees of 20". Many values sit within one SD of the mean, but not all; some lie well beyond it.
A's distances from 20 are 2, 1, 0, 1, 2, giving an SD of about 1.4. B's are 10, 5, 0, 5, 10, giving about 7.1. (Some calculators use a slightly different version and show about 1.6 and 7.9; the story is the same.)
Check yourself
An SD of 5 means no value is more than 5 away from the mean.
Show the answer
False
False. The SD is a typical distance, not a maximum. In City B the SD is about 7, yet two days sit 10 degrees from the average. In most data some values lie beyond one SD, and a few beyond two.
THE MIDDLE HALF
Interquartile range: spread without the extremes
The interquartile range (IQR) is the range of the middle half of the data: from the value a quarter of the way up the line (the 25th percentile) to the value three quarters of the way up (the 75th). Because it ignores the top and bottom quarters, one freak value hardly moves it. It pairs with the median the way the SD pairs with the mean. In a box plot, the box is the IQR.
House prices in a district: the IQR says where the middle half of homes sit, without being dragged about by the one mansion or the one ruin.
Check yourself
Negar records a month of commute times. One day a train breakdown makes her trip take 3 hours. Which measure of spread changes most because of that one day?
- The range
- The interquartile range
- Both change by the same amount
Show the answer
The range
Right. The range is largest minus smallest, so a new largest value changes it at once. The IQR only looks at the middle half, where that 3-hour day doesn't sit.
"The average commute is 30 minutes"
Low spread
Nearly everyone takes 25 to 35 minutes. The average is a good guess for any one person, and you can plan around it.
High spread
Some take 5 minutes and some take 90. The average is the same 30, but it's a poor guess for any one person: you could be early or badly late.
Check yourself
Two buses both take 30 minutes on average. Bus X has an SD of 2 minutes; bus Y has an SD of 12 minutes. Which do you take to a job interview?
- Bus X, because it's predictable
- Bus Y, because it's sometimes much faster
- It makes no difference, since both average 30 minutes
Show the answer
Bus X, because it's predictable
Right. With an SD of 2 minutes, X almost always takes around 28 to 32 minutes. Y often misses 30 by 12 minutes or more, in either direction, and late is the direction that costs you.
Why readers need spread
- Low spread: the average is a good guess for any single case. High spread: it isn't.
- Two investments with the same average return but different spread carry different risk.
- A treatment that helps "on average" may help some people a lot and others not at all.
- Comparing two groups on averages alone hides half the story; ask how spread out each one is.
- Range is quick but fragile; SD goes with the mean; IQR goes with the median and shrugs off extremes.
Lesson recap
- Cities A (18 to 22 °C) and B (10 to 30 °C) share a mean of 20 but feel nothing alike: the difference is spread.
- Range is largest minus smallest: 4 for A, 20 for B. One odd value can change it a lot.
- Standard deviation is the typical distance from the mean, in the data's own units: about 1.4 degrees for A, about 7 for B.
- An SD is not a maximum; some values lie well beyond it.
- The interquartile range covers the middle half of the data, ignores extremes and pairs with the median.