
Putting it together: a trading plan and a journal
Write down your rules before you trade, record every trade in R, and use the numbers, not your feelings, to judge whether anything is working.
Trading plan
A short written set of rules, made before any trade, that decides in advance what you will do in each situation. Its job is to make decisions while you are calm, so that you do not have to make them while money is moving.
"I risk 1% per trade. My stop goes where the setup is proven wrong. After −3% in a day, I stop until tomorrow."
What a plan answers, lesson by lesson
- What and when
Which markets you trade and on which timeframe. Fewer is easier to learn.
- The setup
The situation you look for, described precisely enough that someone else could spot it (lesson 6).
- Entry and stop
Which order type you enter with (lesson 4) and where the stop goes: where the idea is wrong (lesson 8).
- Risk and leverage
Risk per trade, for example 1% (lesson 7), and the highest leverage you will ever use (lesson 9).
- When to stop
A maximum daily or weekly loss, for example −3% in a day, after which you stop trading until the next period.
- Cost check
Whether the expected move is large compared with the round-trip cost (lesson 10).
Check yourself
Negin's plan says: stop trading for the day after −3%. She is at −3% and sees what looks like a perfect setup. What does her plan tell her to do?
- Take it, but at half size
- Stop for the day; the setup can wait until tomorrow
- Take it, because a perfect setup is an exception
- Take it at double size to win the day back
Show the answer
Stop for the day; the setup can wait until tomorrow
Right. The rule exists for exactly this moment, when a loss makes every setup look like the one that will fix it. Setups come back; a blown account does not.
Trading journal
A record of every trade, written right after it closes: date, market, setup, entry, stop, exit, size, fees, result in R, what you felt, and one honest column: followed the plan? Y/N. The plan says what you meant to do; the journal shows what you actually did.
"12 May · setup: bounce at support · entry 50, stop 48, exit 54 · 50 shares · fees 6 · +2R · calm · plan: Y"
Check yourself
Does it belong in the plan, written before trading, or in the journal, written after each trade?
- Risk 1% per trade
- Stop trading after −3% in a day
- Stops go where the setup is proven wrong
- Exit price and result: +2R
- Felt impatient, entered early
- Followed the plan? N
Show the answer
Plan (before): Risk 1% per trade, Stop trading after −3% in a day, Stops go where the setup is proven wrong
Journal (after): Exit price and result: +2R, Felt impatient, entered early, Followed the plan? N
Step through it

The plan card, written first A card titled PLAN holds three short rows: RISK 1%, SL with a tick, and MAX DAY −3%. Before any trade, the rules are written down: how much to risk, that every trade has a stop, and when to stop for the day.
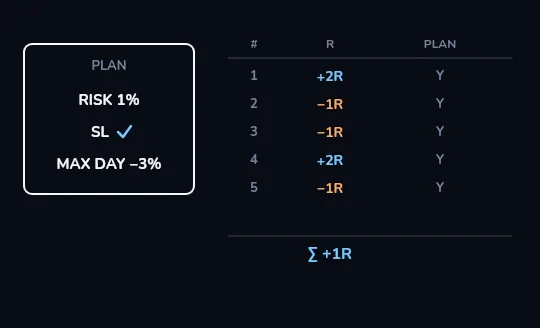
Five trades in R: Σ +1R A journal table appears beside the plan, with columns #, R and PLAN. Five rows fill in: +2R, −1R, −1R, +2R, −1R, wins in blue and losses in orange, each marked Y for followed the plan. Two wins of 2R and three losses of 1R leave the total at Σ +1R.
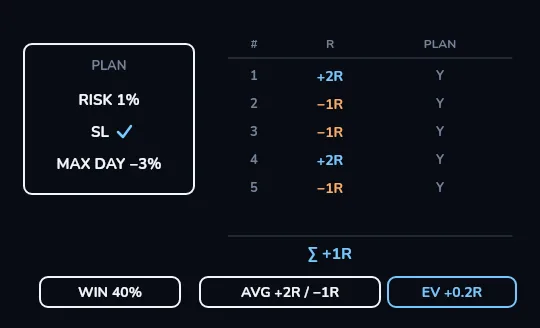
The stats: WIN 40%, EV +0.2R A strip of three boxes appears under the table: WIN 40%, AVG +2R / −1R, and EV +0.2R. Only 40% of trades won, yet the expectancy is positive, because each win is twice the size of each loss: 0.4 × 2 − 0.6 × 1 = +0.2R.
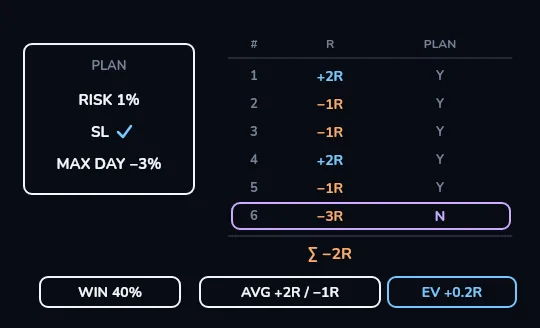
Row 6: −3R, plan N, and Σ −2R A sixth row slides in, outlined in lilac: −3R, with N in the PLAN column, because the stop was moved. The total drops from +1R to Σ −2R. One trade that broke a rule erased everything the first five made, and the journal shows exactly which rule broke.
Check yourself
Farhad's journal shows five trades: +2R, −1R, −1R, +2R, −1R. What is his total?
- −1R
- +1R
- +4R
- +7R
Show the answer
+1R
Right. Wins: 2 + 2 = 4R. Losses: 1 + 1 + 1 = 3R. 4 − 3 = +1R.
Check yourself
In the same five trades, what is Farhad's win rate?
- 20%
- 40%
- 60%
- 100%, because the total is positive
Show the answer
40%
Right. Two winners out of five trades is 40%. He is ahead overall because the wins are twice the size of the losses.
SAMPLE SIZE
Five trades prove nothing
Farhad's +0.2R per trade looks encouraging, but five results could easily come from luck, in either direction. Judge a strategy only on a large sample, dozens of trades at the very least, taken the same way and recorded honestly. Until then, the journal's most useful column is often not R but followed the plan? Y/N: it tells you whether you are even testing the strategy you wrote.
Flip a fair coin five times and getting four heads is not rare. Nobody would call the coin biased from that; five trades deserve the same caution.
Check yourself
After five trades with a positive total, Farhad can be confident his strategy works.
Show the answer
False
False. Five results are far too few to separate skill from luck. He needs dozens of trades, taken the same way and recorded honestly, before the numbers say anything reliable, in either direction.
The whole course in six lines
- A price is the last deal a buyer and a seller agreed on.
- The order book, the spread and your order type decide what you actually pay.
- Candles, trends and levels describe the past; they are not predictions.
- Size every position from your risk and your stop, and remember that leverage multiplies both ways.
- Costs are certain, and the research on short-term traders is sobering.
- A written plan and an honest journal turn feelings into numbers.
Lesson recap
- A trading plan, written before any trade, fixes the markets, setup, entry, stop, risk per trade, leverage limit and a maximum daily loss.
- A journal records every trade, its result in R and whether you followed the plan.
- Five trades of +2R, −1R, −1R, +2R, −1R total +1R: a 40% win rate and +0.2R expectancy.
- One broken rule, a −3R trade with a moved stop, turned the total to −2R; the journal shows exactly where.
- Five trades prove nothing; start with paper trading or tiny size, and deciding not to trade is a valid result.