
Why most short-term traders lose
Look at what the research actually found, the arithmetic of losses and win rates, and the habits of mind that push traders to break their own rules.
What the research found (figures are approximate)
- ESMA, the EU markets regulator (2018): across brokers, about 74-89% of retail CFD accounts lost money. EU brokers must now show their own percentage on their sites.
- Barber and Odean (2000), about 66,000 US households, 1991-96: the most active traders earned about 11.4% a year while the market returned about 17.9%; trading costs explained much of the gap.
- Chague, De-Losso and Giovannetti (2019), Brazil's futures market: of individuals who day-traded on more than 300 days, about 97% lost money, and only about 1% earned more than the minimum wage.
Check yourself
According to ESMA's 2018 review, roughly what share of retail CFD accounts lost money?
- About 10-20%
- About half
- About 74-89%
- Nearly none, once beginners are excluded
Show the answer
About 74-89%
Right. Across brokers, ESMA found about 74-89% of retail CFD accounts losing money, which is why EU brokers now have to publish their own figure.
COMPETITION AND COSTS
A contest that is behind before it starts
Over short periods, one trader's gain on a price move is roughly another's loss: before costs, the gains and losses between participants roughly cancel out. Then commissions, spreads and slippage (lesson 10) are taken from everyone, so after costs the group as a whole is behind. And retail traders are not playing each other alone: they compete with professionals who have faster data, lower costs and more capital.
Picture a table where the players' winnings and losses cancel, but the house takes a small cut from every hand. The longer the evening goes on, the more the table as a whole has lost.
Check yourself
Even if short-term traders' gains and losses cancel out before costs, the group as a whole ends up behind after costs.
Show the answer
True
True. Costs are paid on every trade by everyone, win or lose. If the gains and losses between traders cancel out, what is left for the group is minus the costs.
Step through it
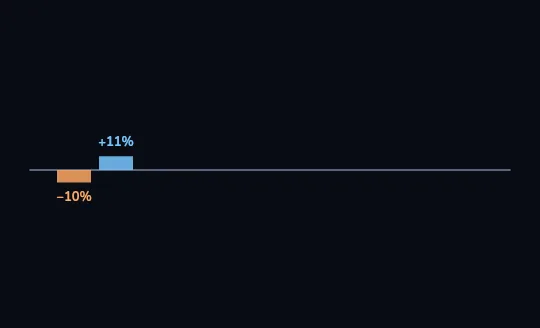
Lose 10%, need +11% An orange bar drops below the line, marked −10%, and a blue bar beside it rises, marked +11%. Lose 10% and you need about 11% to get back to where you were: 90 × 1.111 ≈ 100. Close, so far.
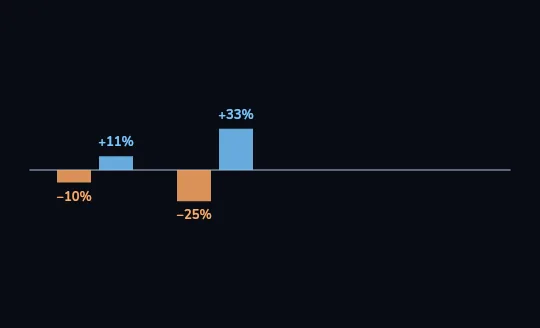
Lose 25%, need +33% A second pair appears next to the first: an orange bar at −25% and a taller blue bar at +33%. Lose a quarter and you need a third: 75 × 1.333 ≈ 100. The blue bars are starting to outgrow the orange ones.
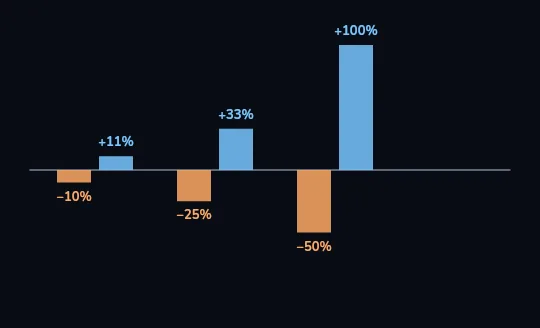
Lose 50%, need +100% A third pair: an orange bar at −50% and a blue bar at +100%, twice as tall. Lose half and you must double what is left just to break even: 50 × 2 = 100.
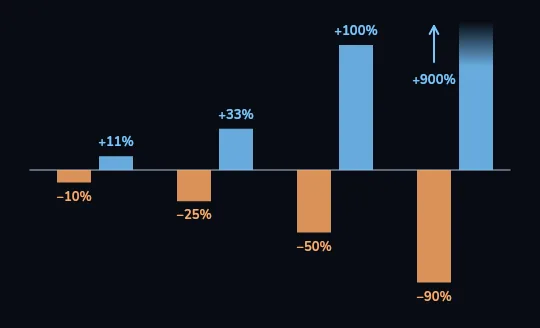
Lose 90%, need +900% A fourth pair: an orange bar at −90%, and a blue bar that runs off the top of the frame with an arrow marked +900%. Lose 90% and the 10 left must grow tenfold to get back to 100. Small losses are recoverable; big ones almost never are.
Check yourself
Kaveh's account falls 50%, from 10,000 to 5,000. What gain does he need to get back to 10,000?
- +50%
- +75%
- +100%
- +150%
Show the answer
+100%
Right. 5,000 has to double to reach 10,000, which is +100%. The gain is worked out on the smaller amount that is left.
Expected value (expectancy)
What a trade makes on average, over many repeats. EV per trade = (win rate × average win) − (loss rate × average loss). It uses both how often you win and how big the wins and losses are, which is why a high win rate alone tells you almost nothing.
Win 40% of the time with wins of 2R, lose 60% with losses of 1R: 0.4 × 2 − 0.6 × 1 = +0.2R per trade on average, before costs.
Strategy A: wins 40%, average win 2R, average loss 1R
  0.40 × 2   =  0.80
  0.60 × 1   =  0.60
  EV         =  0.80 − 0.60  =  +0.20R

Strategy B: wins 70%, average win 0.3R, average loss 1R
  0.70 × 0.3 =  0.21
  0.30 × 1   =  0.30
EV = 0.21 − 0.30 = −0.09RA loses most trades and makes money on average.
B wins most trades and loses money on average.
(Both before costs; lesson 10's costs come off both.)Strategy B feels wonderful: seven winners out of ten. But the three losers are each more than three times the size of a win.
Check yourself
A strategy wins 40% of trades at +2R and loses 60% at −1R. What is its expected value per trade, before costs?
- −0.2R
- +0.2R
- +0.8R
- +1R
Show the answer
+0.2R
Right. 0.4 × 2 = 0.8, minus 0.6 × 1 = 0.6, gives +0.2R per trade on average.
Check yourself
- Tara wins 70% of her trades, taking small profits of about 0.3R each, but lets each loser run to about 1R. After 100 trades she is down.
- Babak wins only 40% of his trades, but each win is about 2R and each loss is cut at 1R. After 100 trades he is up, before costs.
What explains why the trader who wins more often is the one losing money?
- Tara was unlucky; with a 70% win rate she must come out ahead eventually
- What decides the result is win rate combined with the size of wins and losses, and Tara's losses are more than three times her wins
- Babak must be taking more risk per trade
- Win rate is all that matters, so the numbers must be wrong
Show the answer
What decides the result is win rate combined with the size of wins and losses, and Tara's losses are more than three times her wins
Exactly. Tara's expectancy is 0.7 × 0.3 − 0.3 × 1 = −0.09R; Babak's is 0.4 × 2 − 0.6 × 1 = +0.2R. A high win rate with small wins and big losses can still lose.
Habits of mind that break rules
- Overconfidence: believing you know more than you do, which leads to more trading and, in the research, lower returns.
- The disposition effect: selling winners too early and holding losers too long (described by Shefrin and Statman in 1985 and measured by Odean in 1998).
- Revenge trading: jumping into a new, bigger trade to win back a loss.
- FOMO, fear of missing out: chasing a price that has already moved a lot.
- Hindsight bias: after the fact, every chart looks obvious, so the next move feels more predictable than it is.
Check yourself
Yasaman keeps selling her trades as soon as they show a small profit, but holds on to losing trades for weeks, hoping they come back. What is this pattern called?
- The disposition effect
- Hindsight bias
- FOMO
- Survivorship bias
Show the answer
The disposition effect
Right. Selling winners too early and holding losers too long is the disposition effect, and it produces exactly Tara's small wins and large losses.
Lesson recap
- Large studies point the same way: ESMA found about 74-89% of retail CFD accounts losing, and in Brazil about 97% of persistent day traders lost money.
- Before costs, short-term traders' gains and losses roughly cancel; after costs, the group is behind, and it competes with professionals.
- Losses need bigger gains to recover: −10% needs +11%, −50% needs +100%, −90% needs +900%.
- Expected value, not win rate, decides results: 40% wins of 2R is +0.2R; 70% wins of 0.3R against 1R losses is −0.09R.
- Overconfidence, the disposition effect, revenge trading, FOMO and survivorship bias push traders off their own rules.