
Trends, support and resistance
Spot an uptrend by its higher highs and higher lows, mark the levels where price keeps stalling, and learn why these are zones of probability, not promises.
TREND
Higher highs and higher lows
Price rarely moves in a straight line; it zig-zags. The turning points are called swing highs and swing lows. An uptrend is a series of higher highs (HH) and higher lows (HL): each peak tops the last one and each dip stops above the last one. A downtrend is the mirror image: lower highs and lower lows. When neither pattern holds and price moves sideways between two levels, it is called a range.
Lows at 90, then 95, then 100, and highs at 100, then 106, then 112. Every swing is higher than the one before: an uptrend.
swing lows:   90 → 95 → 100    each higher  → HL HL HL
swing highs: 100 → 106 → 112   each higher  → HH HH HH

higher highs + higher lows = uptrendUptrendCheck both rows. If the highs kept rising but a low dropped below the previous low, the pattern would be broken: that is often the first sign that a trend is weakening, though not proof that it has ended.
Check yourself
A chart has swing lows at 90, 95 and 100, and swing highs at 100, 106 and 112. What does it show?
- An uptrend: higher highs and higher lows
- A downtrend, because each low was followed by a fall
- A range, because it keeps going up and down
- Nothing can be said without the volume
Show the answer
An uptrend: higher highs and higher lows
Right. Every high tops the previous high and every low stays above the previous low. That is the definition of an uptrend.
Two kinds of level
Support
A price area where falls have repeatedly stopped, because buyers stepped in there.
Example: the price dropped to about 90 three times and turned back up each time.
Resistance
A price area where rises have repeatedly stalled, because sellers stepped in there.
Example: the price climbed to about 110 three times and turned back down each time.
Check yourself
The price has turned down near 110 three times in the past month. What would traders call 110?
- Support
- Resistance
- The spread
- A higher low
Show the answer
Resistance
Right. A level where rises keep stalling and turning down is resistance. Support is the mirror image, below the price.
ZONES, NOT LINES
Why levels sometimes work, and why they break
Support and resistance are zones, not exact prices: think 109 to 111, not 110.00. Why do they work at all, sometimes? Many people watch the same obvious levels and place orders around them, and people remember prices where they bought or wished they had sold. That makes levels partly self-fulfilling. But they are areas where buying or selling has appeared before, not places where it must appear again. Every level eventually breaks.
A level at 90 held three times. On the fourth visit, after bad news, the price falls straight through to 82. Nothing about the first three bounces promised a fourth.
Check yourself
A support level that has held three times can be treated as a guaranteed floor.
Show the answer
False
False. Support is a zone where buying has appeared before. It can, and eventually does, break. Treating it as a guarantee is how people skip their stop-loss and take a much larger loss than planned.
BREAKOUTS
Breaking through, faking it, and switching roles
A breakout is when the price closes clearly beyond a level, for example several closes well above 110. A false breakout is when it pokes through and then falls back inside, which is common. After a real breakout, the old level often switches role: old resistance can act as support when the price pulls back to it (a retest), and old support can act as resistance. This is called role reversal. Often, not always.
The price has stalled at 110 for weeks. It breaks out to 116, dips back to 110, and bounces. The level that used to stop rises has just stopped a fall.
Check yourself
The price breaks above 110 after stalling there for weeks, then dips back to 110 and bounces. What is 110 acting as now?
- Resistance, as before
- Support: old resistance has switched role
- A false breakout
- A higher high
Show the answer
Support: old resistance has switched role
Right. After a breakout, old resistance often becomes support on a pullback. That is role reversal, and it is a tendency, not a rule.
Check yourself
- The price has stalled at 110 for weeks. One morning it trades up to 111.50, then sells off and closes the day at 107, back inside the range.
- The price has stalled at 110 for weeks. It closes at 113, then 114, then 115 over the next three days, and stays above 110.
What is the key difference between these two cases?
- The first is a false breakout, since it poked through and closed back inside; the second is a breakout, with clear closes beyond the level
- The first is a breakout because it went higher faster
- Both are false breakouts, because resistance never breaks
- Both are breakouts, because both traded above 110
Show the answer
The first is a false breakout, since it poked through and closed back inside; the second is a breakout, with clear closes beyond the level
Exactly. Trading above a level for a moment isn't enough; what matters is closing clearly beyond it. The first poked through and fell back, a false breakout, which is common.
Step through it

Price zig-zags upward A white price line is drawn from left to right. It doesn't climb in a straight line: it rises, dips, rises again, dips again, each time ending a little higher. Price rarely moves in a straight line. It zig-zags.
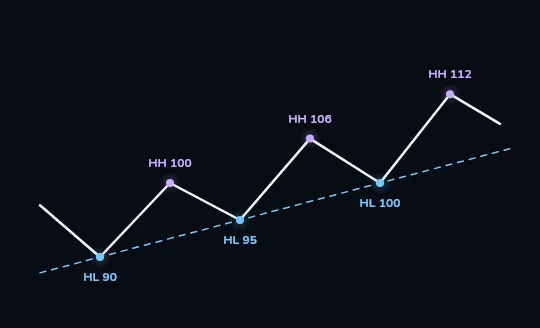
HL 90, 95, 100 and HH 100, 106, 112 The turning points are marked: blue dots at the lows, HL 90, HL 95 and HL 100, and lilac dots at the highs, HH 100, HH 106 and HH 112. A dashed blue trend line runs under the lows. Each low is higher than the last, and so is each high: that pattern is an uptrend.
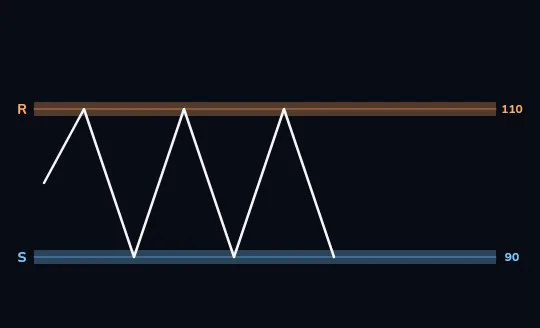
A range: S at 90, R at 110 A new price line bounces between two bands: a blue band at 90 labelled S and an orange band at 110 labelled R. It touches each band three times. Price keeps stopping near 90 and stalling near 110: support below, resistance above. They are drawn as bands, not thin lines, because they are zones.
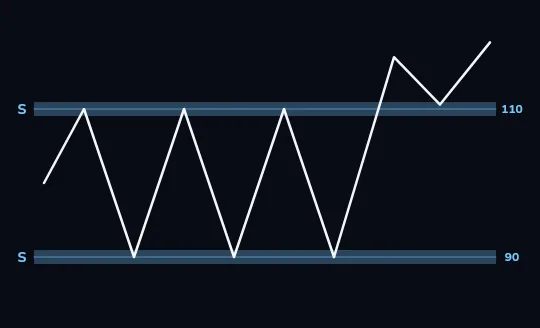
Breakout: 110 turns from R to S The price breaks up through the 110 band, pulls back to it and bounces off it. The band's label and colour change from orange R to blue S. After a breakout, old resistance often becomes support. Often, not always: false breakouts are common.
Check yourself
Match each label from the frames to what it means
Show the answer
- HH → A swing high above the previous swing high
- HL → A swing low above the previous swing low
- S → A zone where falls have repeatedly stopped
- R → A zone where rises have repeatedly stalled
Lesson recap
- An uptrend is a series of higher highs and higher lows; a downtrend, lower highs and lower lows; a range, neither.
- Support is a zone where falls have repeatedly stopped; resistance, a zone where rises have repeatedly stalled.
- Levels are zones, not exact prices. They work partly because many people watch them, and they can always break.
- A breakout closes clearly beyond a level; a false breakout pokes through and falls back, which is common.
- After a breakout, old resistance often acts as support on a retest: role reversal, often but not always.
- Charts look obvious in hindsight; the right edge is always uncertain. Education, not financial advice.